
Most traders begin by asking a straightforward question: Is the market going up or down? An additional perspective that can provide deeper insight is: Is the market strength broadly supported, or is it concentrated in a smaller group of stocks?
That distinction matters. Because trading performance often depends less on the index level and more on how many stocks are actually participating.
Linking to the Framework
In a prior article, RL30Slope Z: A Structured Approach to Analyzing Market Rotation and Relative Strength, we introduced RL30Slope Z as a way to standardize how trend behavior is measured across different instruments.
This work builds directly on the methodologies of Dr. Ken Long, where the goal is not prediction, but structured observation, measurement, and decision-making.
The objective is simple: Create a repeatable framework to evaluate relative strength and how it evolves over time.
1. The Hidden Risk in Market Strength
Broad indices can give a misleading picture.
To understand why, it helps to distinguish between cap-weighted and equal-weighted indices:
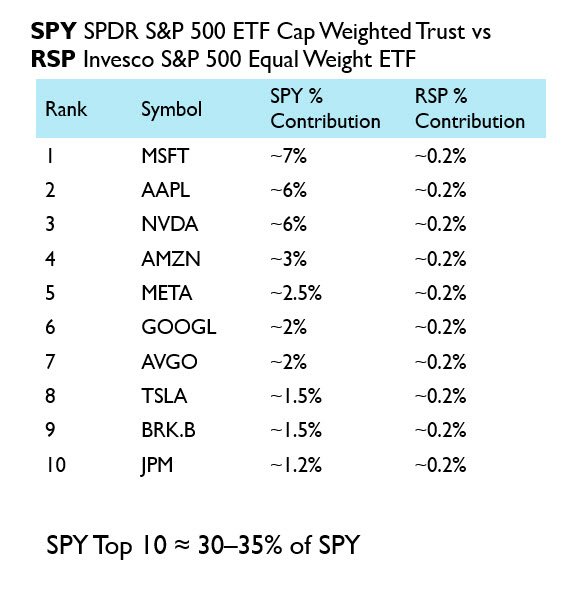
In a cap-weighted index like SPY, larger companies have a greater influence on performance. A small number of large stocks can drive a significant portion of returns.
In an equal-weighted index like RSP, each stock contributes equally, providing a clearer view of how the average stock is behaving.
This difference is important.
In practice:
The index may appear strong
While many individual stocks in the idex are flat or weakening
Understanding Concentration in Cap-Weighted Indices
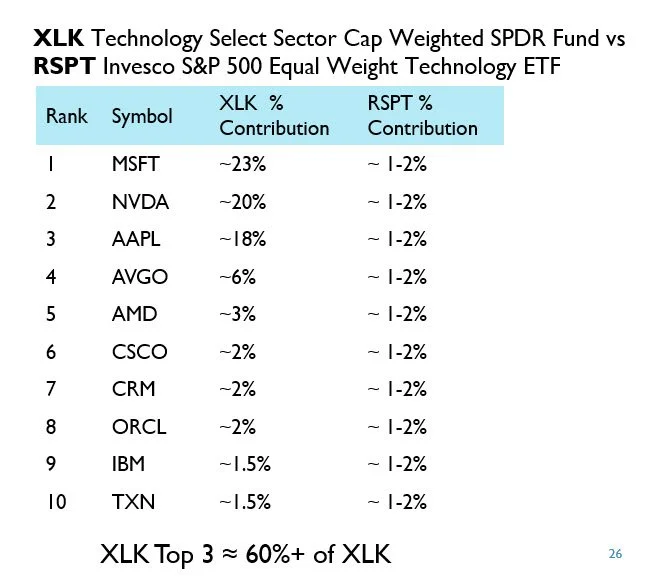
A simplified way to think about cap-weighted indices is that they allocate more capital to larger companies. This does not mean each stock is held in equal amounts. Instead, the number of shares is adjusted so that larger companies represent a larger portion of the portfolio. This can lead to meaningful concentration.
For example:
In XLK, a small number of large technology companies (such as Apple, Microsoft, and Nvidia) can account for a substantial portion of the ETF.
In SPY, the largest companies collectively represent a significant share of index performance.
As a result:
A small number of stocks can drive index-level returns
While many other stocks may not be participating
In extreme cases, index performance can be largely explained by just a handful of stocks.
A Simple Framework to Evaluate Participation
To assess this, we compare:
Market Layer
SPY (cap-weighted)
RSP (equal-weighted)
Sector Layer (Technology Example)
XLK (cap-weighted)
RSPT (equal-weighted)
Why This Comparison Matters
Comparing cap-weighted and equal-weighted ETFs helps answer: Is strength broad — or concentrated? If cap-weighted is strong but equal-weighted is weak → strength is concentrated. If both are strong → participation is broad. This provides a more complete view of market behavior than price alone.
Bringing in RL30Slope Z
Using RL30Slope Z allows us to compare SPY, RSP, XLK, and RSPT on the same statistical scale. This makes it easier to evaluate:
Relative strength
Changes in leadership
Emerging divergence
Implementation in EdgeRater
This framework becomes significantly more powerful when implemented in EdgeRater, where both scanning and backtesting can be performed.
Using EdgeRater, we can:
Scan markets daily/weekly
Track RL30Slope Z across:
SPY vs RSP
XLK vs RSPT
Visualize:
Trend strength (Z-score)
Direction (rising/falling)
Identify:
Rotation
Expansion or contraction in participation
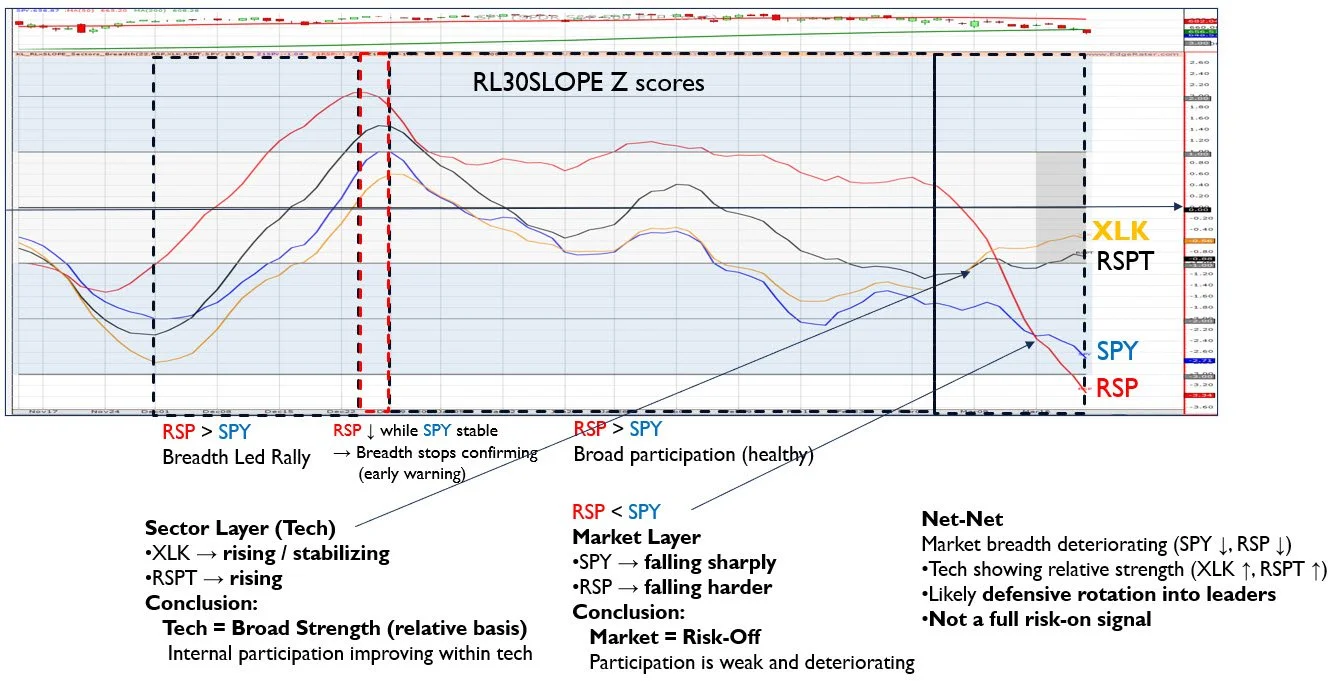
RL30SLOPE Z of XLK vs RSPT and SPY vs RSP in EDGERATER
Most importantly, EdgeRater enables you to test whether these observations actually improve trading results.
For example, within our Owl Bundle User Group (OBUG) we:
Compare baseline strategy performance vs. performance with participation filters
Evaluate how strategies behave in:
Broad participation environments
Concentrated leadership environments
Measure impact on:
Expectancy
Drawdown
Trade consistency
This transforms the framework from a descriptive tool into a validated, data-driven process.
Interpreting the Combinations
Broad Participation (More Favorable Environment)
SPY and RSP both show positive trend behavior
This suggests:
Many stocks are participating
Signals tend to be more consistent
Concentrated Strength (Caution)
SPY strong, RSP weaker
This suggests:
Leadership is narrow
Fewer stocks are driving the move
In these conditions:
Selectivity becomes more important
Position sizing may need adjustment
Early Expansion (Potential Opportunity)
RSP improving while SPY is flat
This may indicate:
Strength building beneath the surface
Early-stage rotation
Broad Weakness (Defensive Environment)
Both SPY and RSP weakening
This suggests:
Deterioration in participation
Increased downside risk
What This Means for Trading Decisions
This framework is not a signal by itself. It is used for context and prioritization. In practice, it can support:
Trade selection
Position sizing
Selectivity
How This Fits into OBUG
Inside the Owl Bundle User Group (OBUG), this type of analysis is part of a broader process:
Evaluating market and sector context
Monitoring changes in participation
Aligning strategies with current conditions
Use EdgeRater to backtest and validate ideas
The focus is not on prediction, but on improving decision-making through better measurement and process.
Final Thought
Market direction is only part of the story.
Participation and leadership often determine how well trading strategies perform.
Comparing cap-weighted and equal-weighted ETFs using RL30Slope Z provides a structured way to evaluate that participation.
Interested in Going Deeper?
If you find this type of structured, research-driven approach useful, you may find value in the work we do inside OBUG. Join us HERE.