
By Griffin Cooper
2/8/2026
In our last OBUG meeting, we noticed some unusual behavior in the XLF sector, specifically in the slope of the RL30Slope Z-scores, a standard measure we use for our weekly market report.
Sector Rotation RL30 Slope Z-Scores:
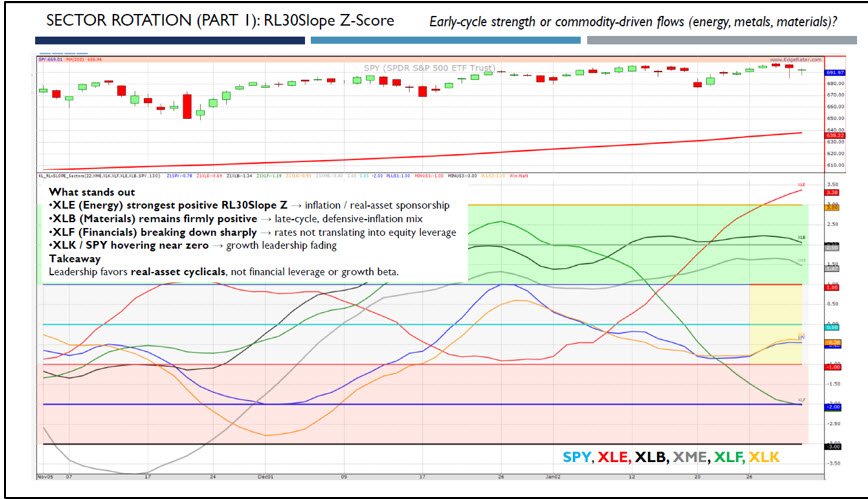
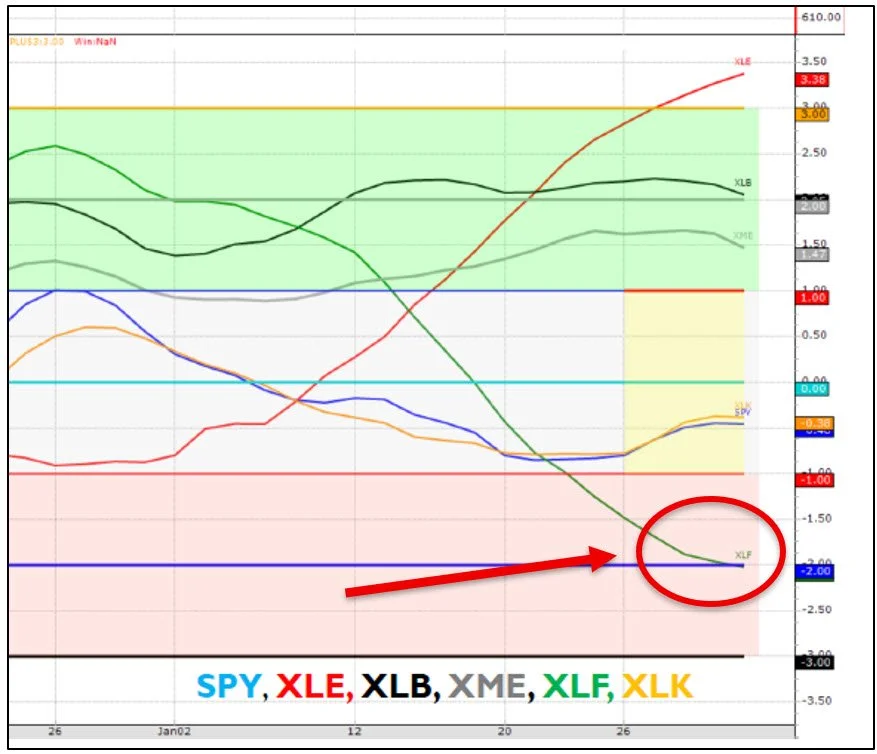
XLF RL30Slope Zscore is now 2 standard deviations below normal.
The XLF’s Z-Score line is clearly lagging the other sectors and has dipped down to -2 standard deviations. Let’s look at the charts to get a better idea of what is going on in XLF and how it could play out.
Long-Term Analysis of XLF
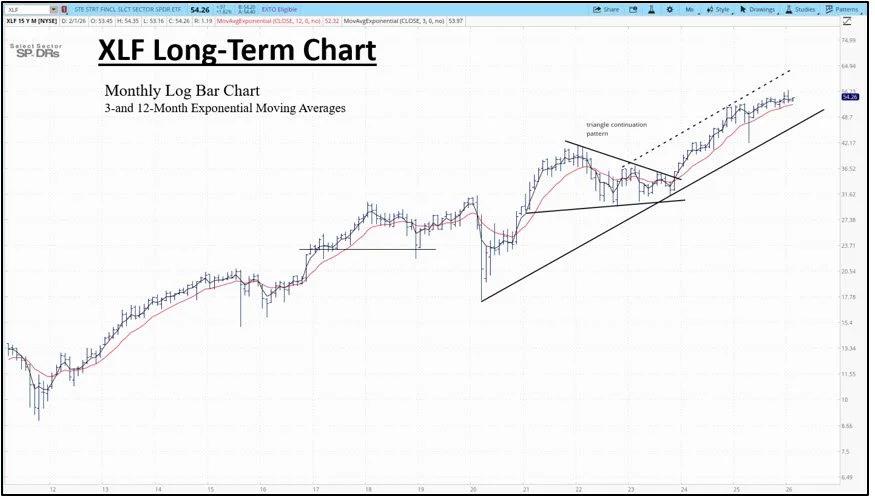
Long-Term Monthly Chart:
The XLF Monthly chart reached a new high in January of 56.52 and is pulling back slightly from that high this month. A tentative uptrend line was formed following the nearly two-year sideways period from 2022 to 2023. The consolidation took the shape of a triangle pattern that completed in December of 2023. Price consequently made a dynamic up leg for the last two years. The pattern completion was also confirmed with the 3/12 moving average buy signal a month before the pattern completed in November.
We look fo a continuation of the bull channel, with a possible consolidation period of the last dynamic up leg.
A close below 29.59, a significant support level, would change our outlook.
We look for continuation of the dynamic up trend.
Medium-Term Analysis of XLF
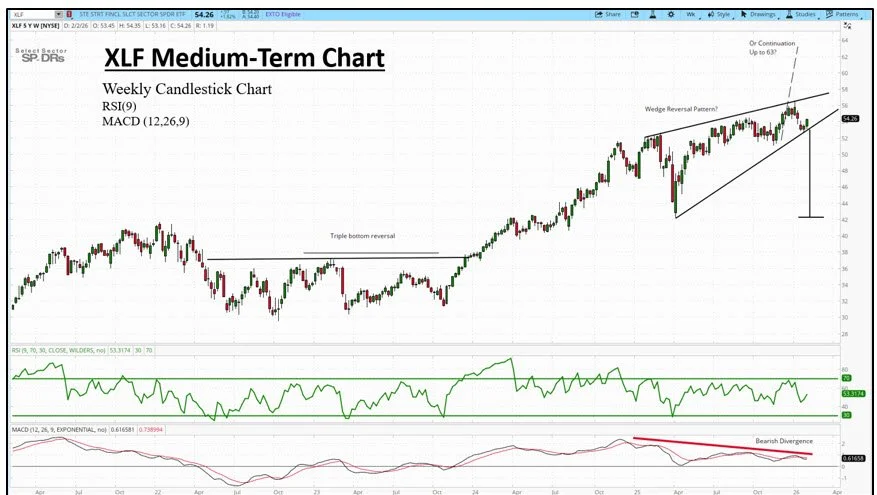
Medium-Term Weekly Chart
After a large triple bottom pattern completed in December of 2023, the XLF weekly has been in an uptrend. However, the recent price action looks to be taking the shape of a possible wedge reversal, not uncommon in what looks like the late stage of this bull trend. The durability of the trend is also called into question with the negative bearish divergence in the MACD lines. However, price action comes first, and we go with the current trend.
We look for a continuation of the present bull trend. A measured move equal to the last leg, approximately 11 points, would project us up to the 63 level.
A close below the 52 level would change our outlook and complete the wedge reversal and break an important support/resistance line. This would project a minimum target of 42.
The XLF ETF is clearly in a critical state, and it will be fascinating to see how the current situation develops in the coming weeks.