
By Griffin Cooper
10/3/2025

Long Term Monthly Chart XLE
Long-Term Analysis of XLE
A dynamic, three-year bull move from 2020 to 2023 has been consolidating for the past two years. Price has formed what looks like a rectangle pattern as it digests the last up leg.
A difficult pattern to forecast, but we go with the trend.
Price found support in April of this year at the bottom edge of the rectangle pattern at 74.79, and has since printed 4 up bars with higher highs and lows, showing bullishness.
Although price has danced above and below the 12-month EMA during the consolidation, nevertheless it has recently crossed to the North, closing above the EMA in the last two months, another sign of recent bullishness.
A decisive above the important 100 level would signal a completion of the rectangle pattern, signaling a breakout with a close above highest high of 98.97 and the important psychological round number of 100. In this case, we would look for a resolution of the pattern with a target of 124.
A decisive close below 74.79 would change our outlook, and signal instead a reversal pattern with further moves South.
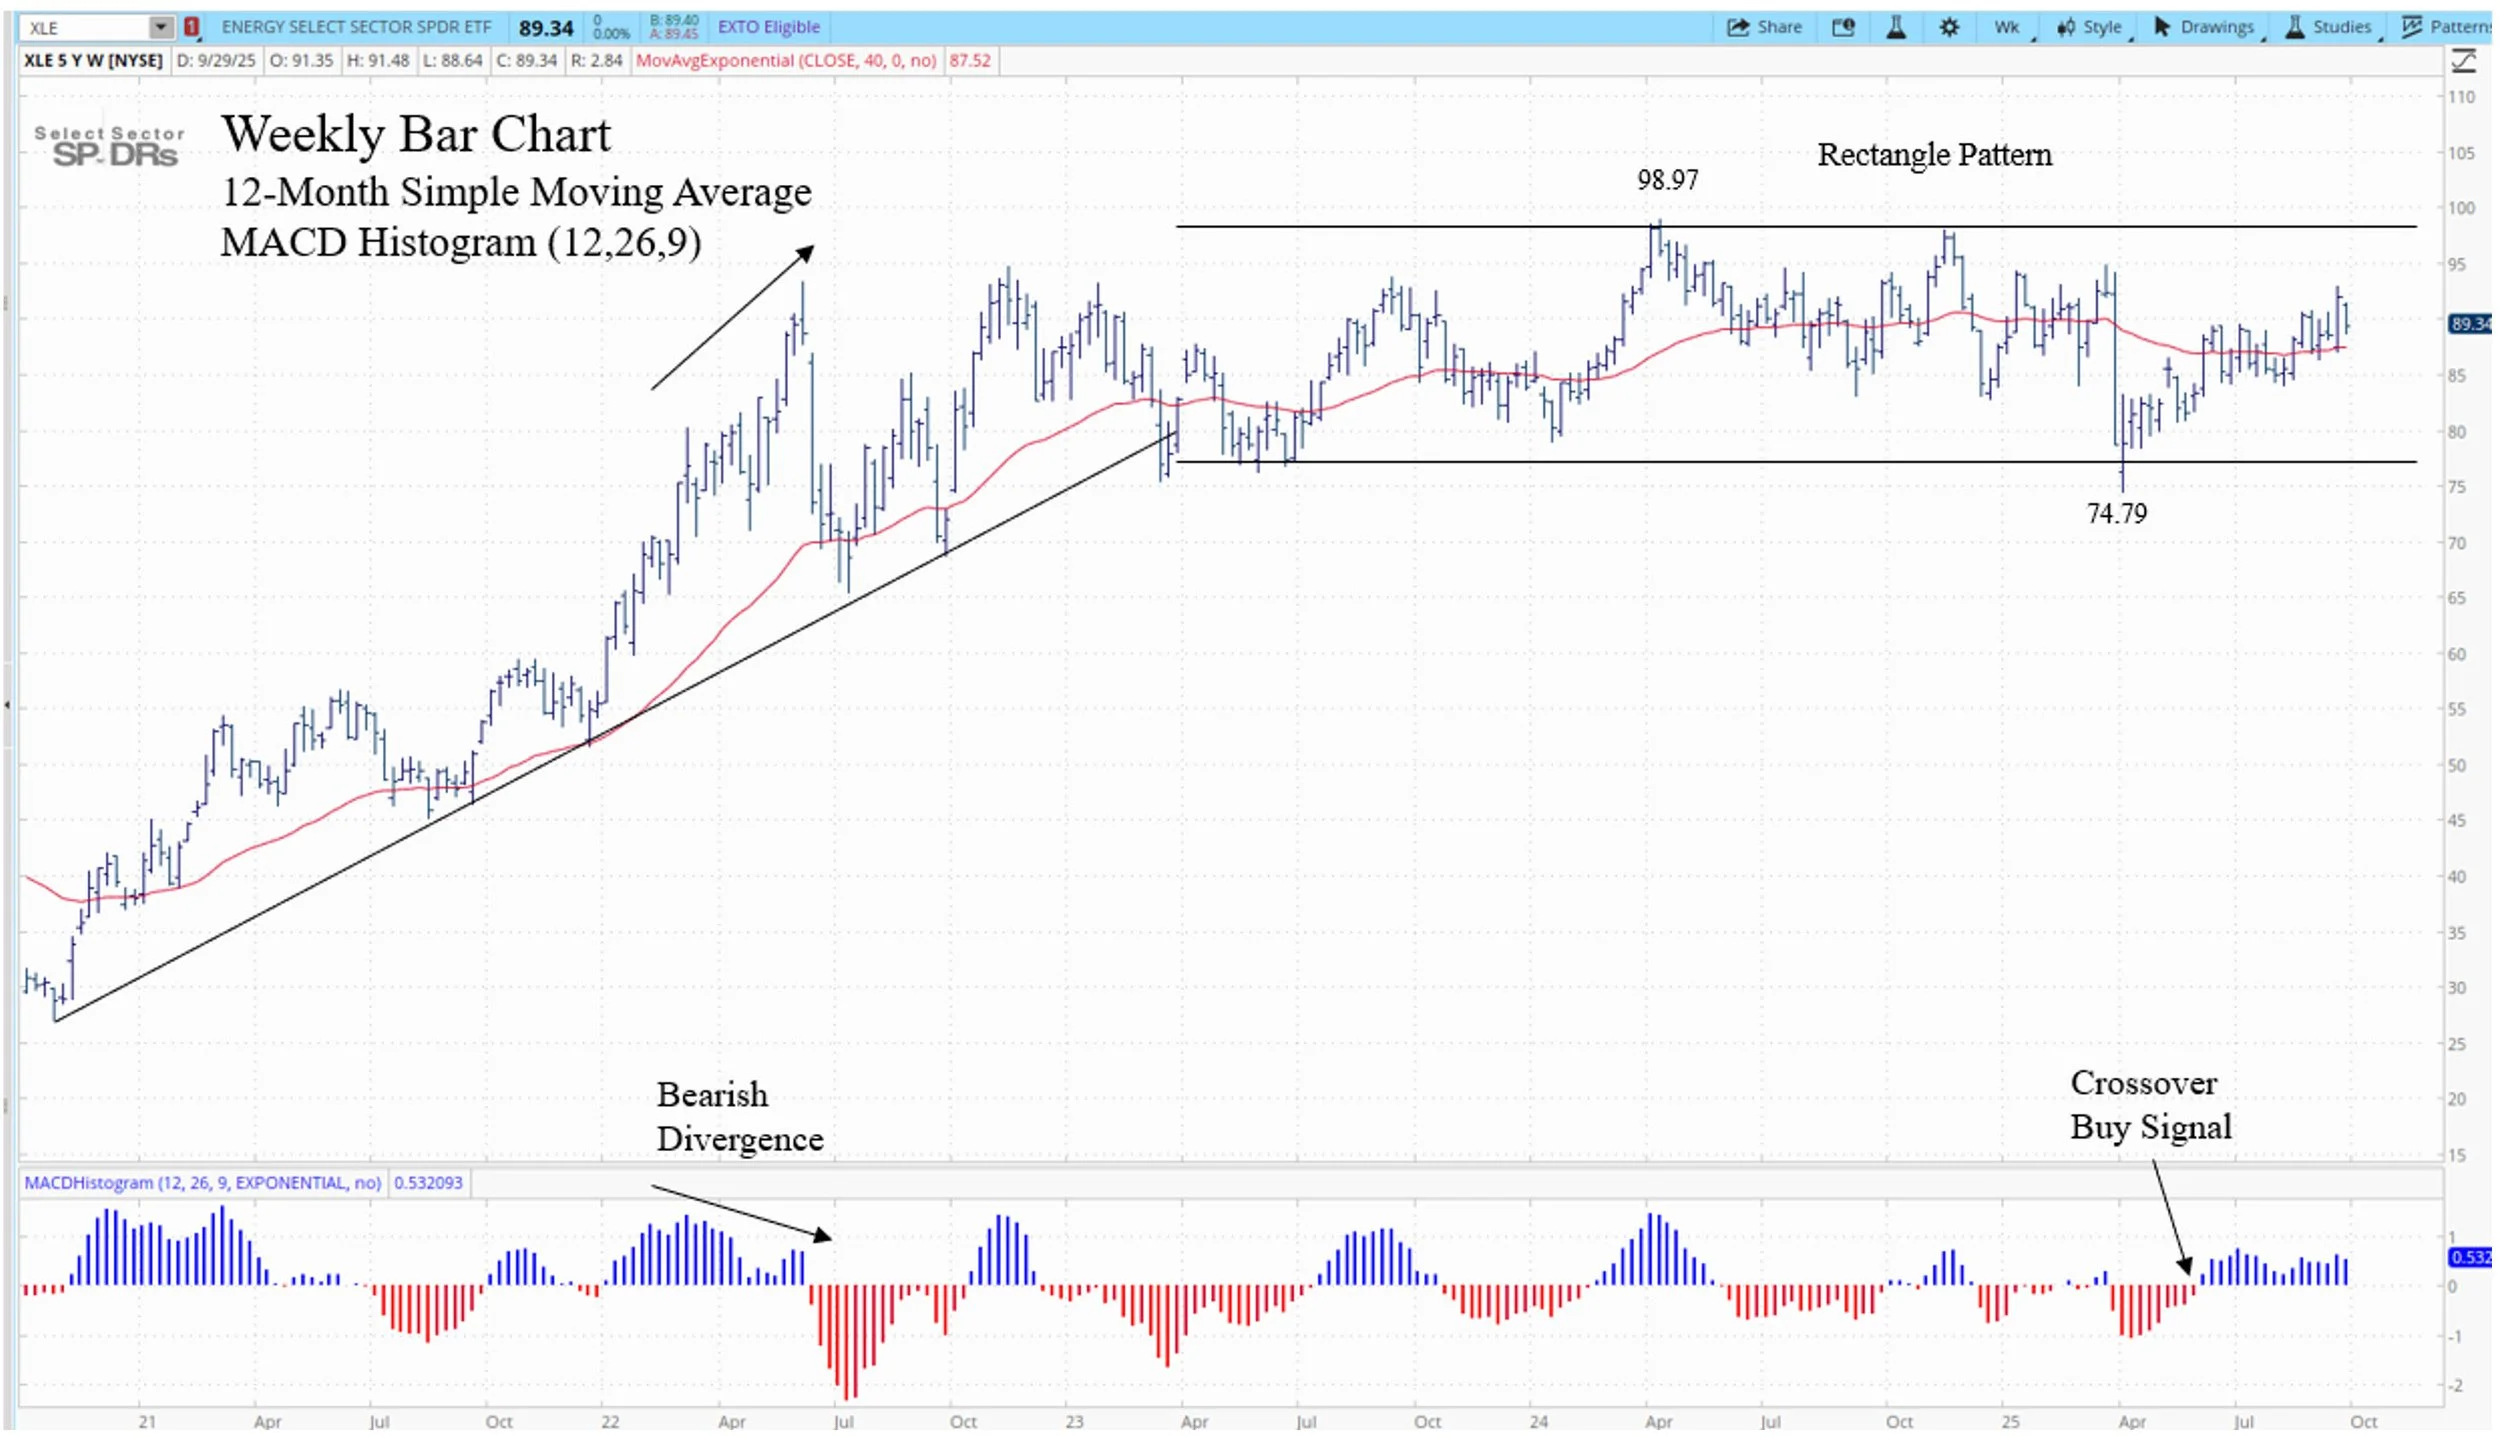
Medium-Term Analysis of XLE
The rally off the low in April of 74.79 has triggered a zero-line crossover buy signal on the MACD histogram. But the oscillator is always subordinate to the trend, which in this case is sideways.
The aforementioned rectangle pattern is traced out more clearly on weekly data, showing the sideways range XLE has been stuck in since April of 2023 between the 75 and 98 levels.
We look for a little more sideways price action over the next one to two months pushing up toward the upper resistance level near 95. As mentioned, the breakout close above 100 will resolve the rectangle pattern, with a resolution at a price target of 124.
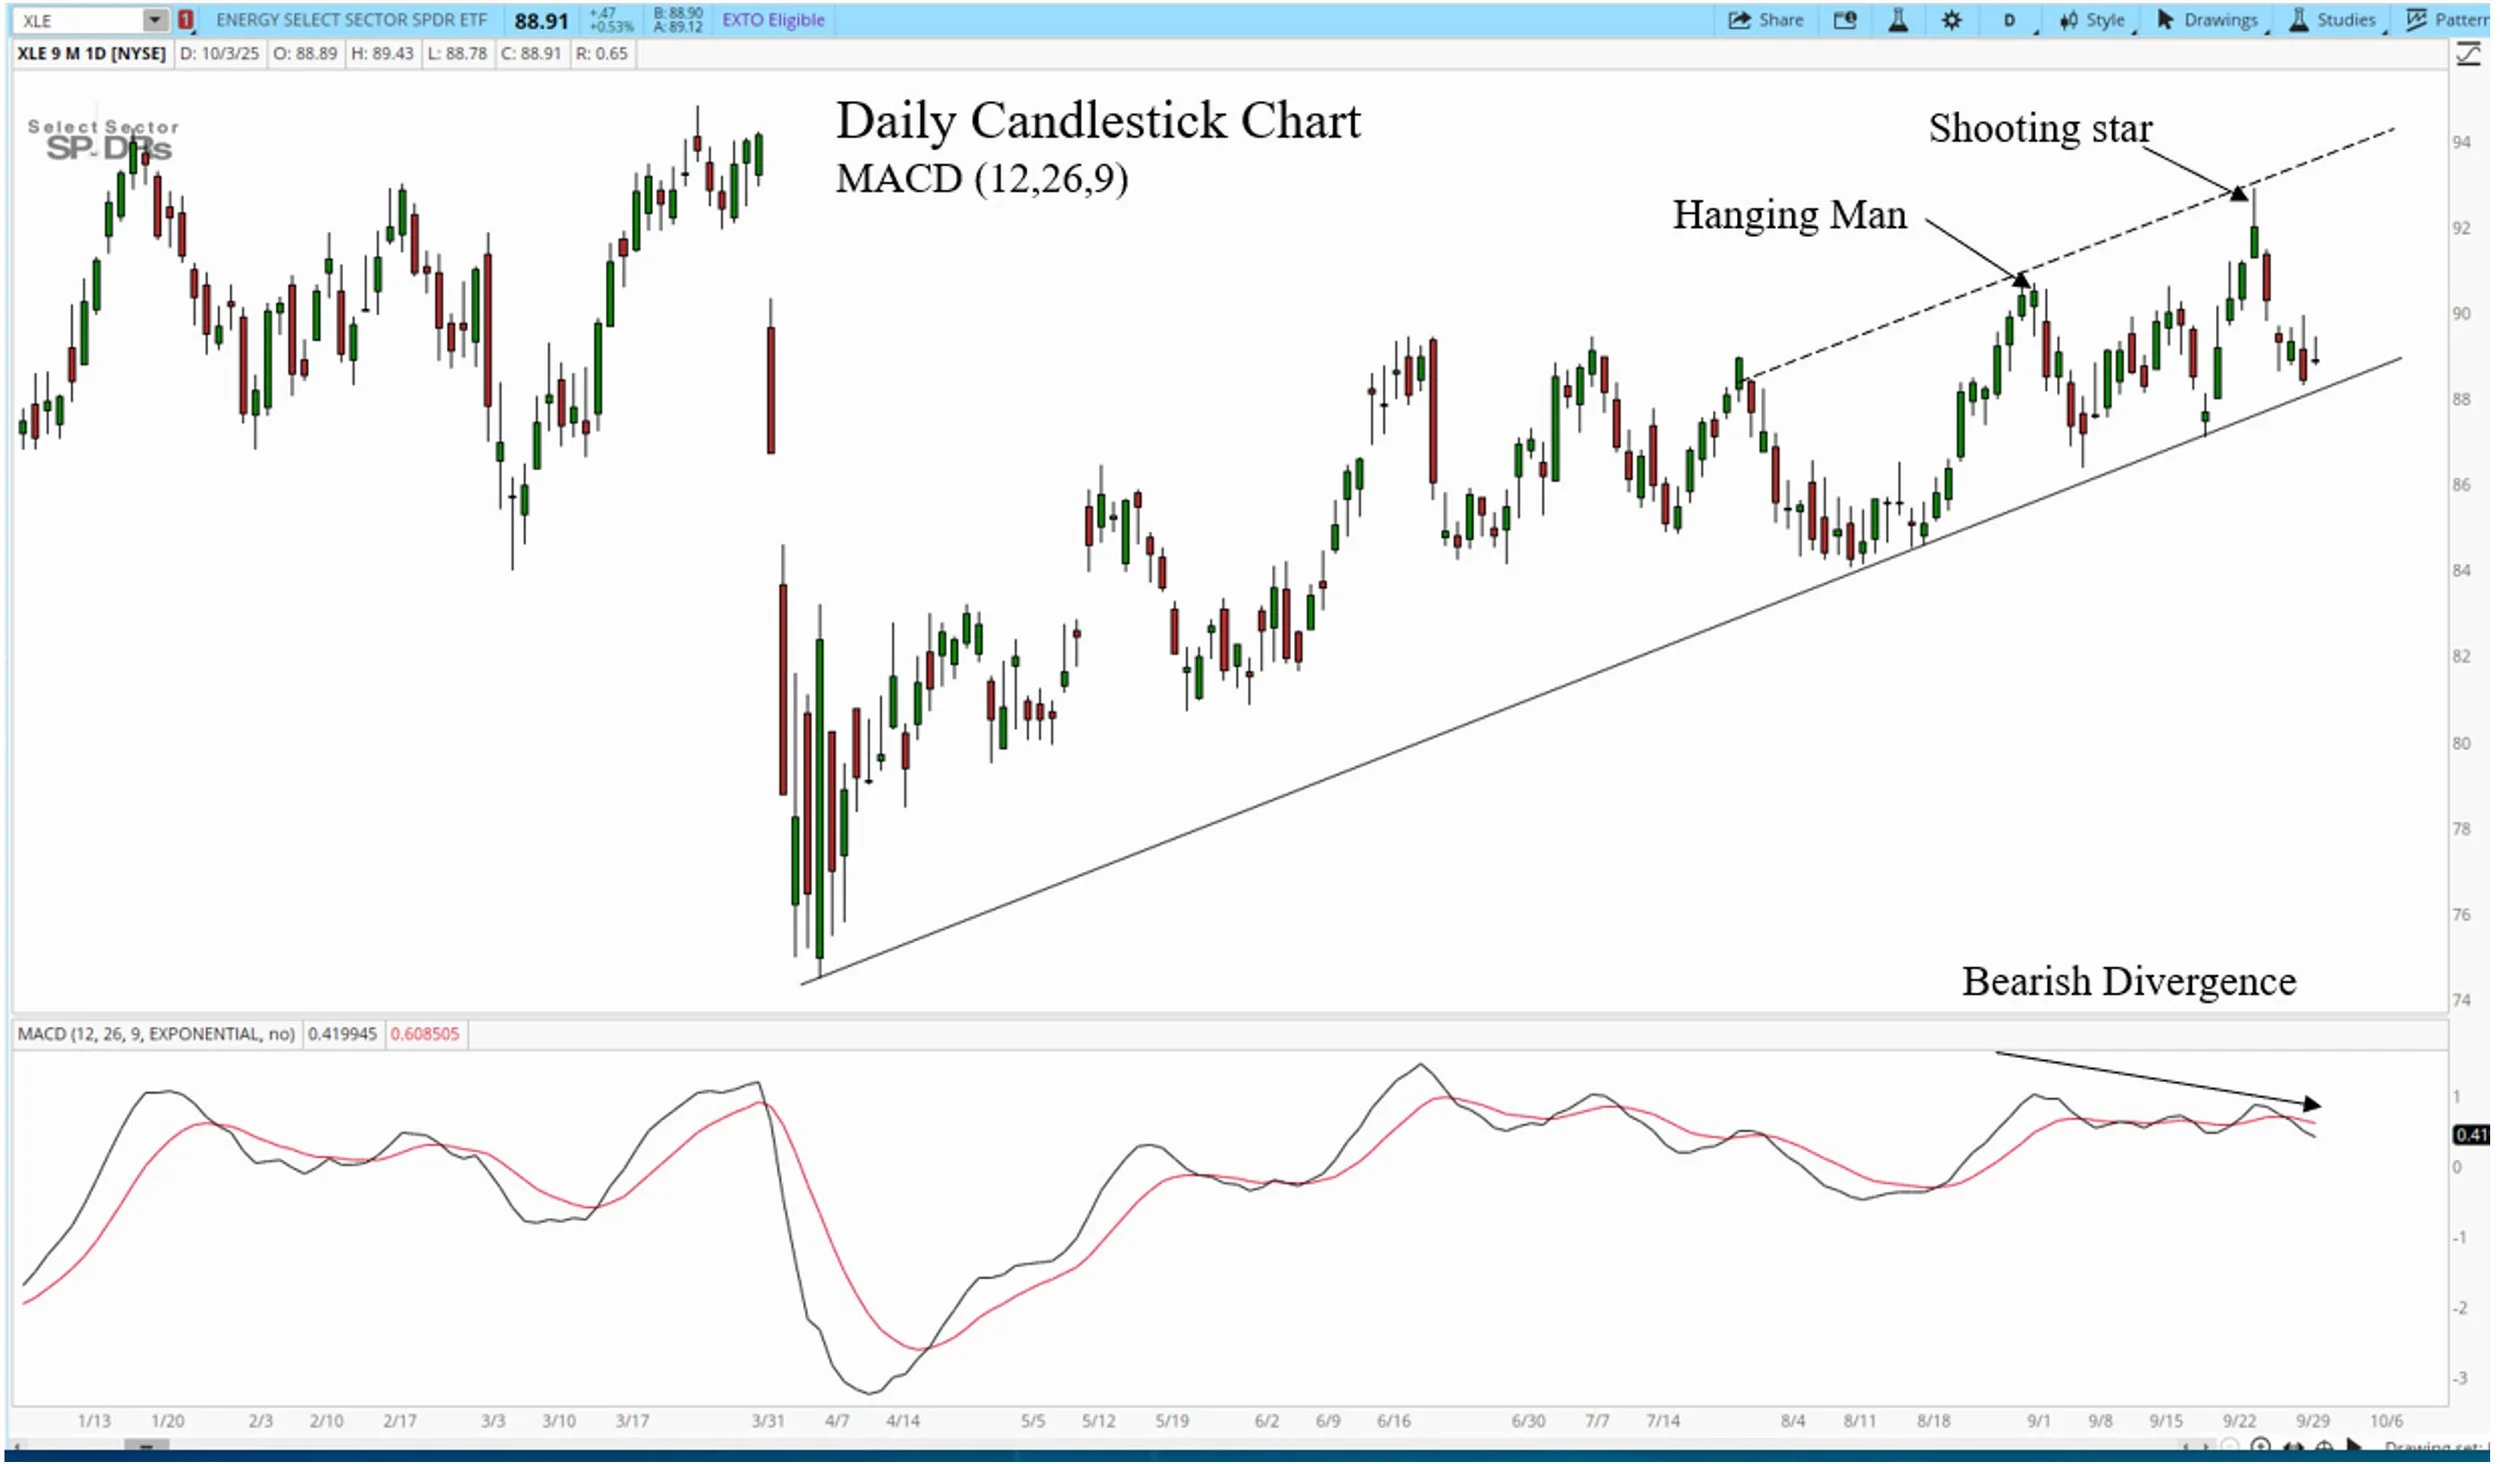
Short-Term Daily Chart:
Short-Term Analysis of XLE
We saw over a 20% drop in XLE in a matter of three days last April with a pair of red Marubozu candles and large gaps. But the bullishness since the large drop has retraced almost all of the move down. This up leg following the April low is traced out more clearly on daily data.
The MACD lines show a bearish divergence recently that was confirmed with a shooting star reversal candle, triggering a short-term reversal. But we must look at it in a broader context, with price as always coming first.
We have a six-month confirmed trendline support with three touches. Note that the shooting star candle occurred near the top of the channel line and the resulting return move is now very close to the trend line.
Our current view is to stay with the support of the trendline, which will need to find support soon around the 88 level.
We look for price to find support in the next few days at the trend line, followed by an upside move to the top of the channel line near 94.
One example of what a Short-term trade strategy could look like:
Buy at 88 (expected trend line support), stop just below 87 (recent low), take profit at 93/94.
At that point, the trader/investor might wish to reduce risk (scale out or move up stop) and consequently play for the longer-term target of 124.
This analysis is for educational purposes only and does not constitute investment advice or a recommendation to buy or sell any security. Trading involves risk of loss.