
By AbleWayTech • OBUG Meeting #138 • October 27, 2025
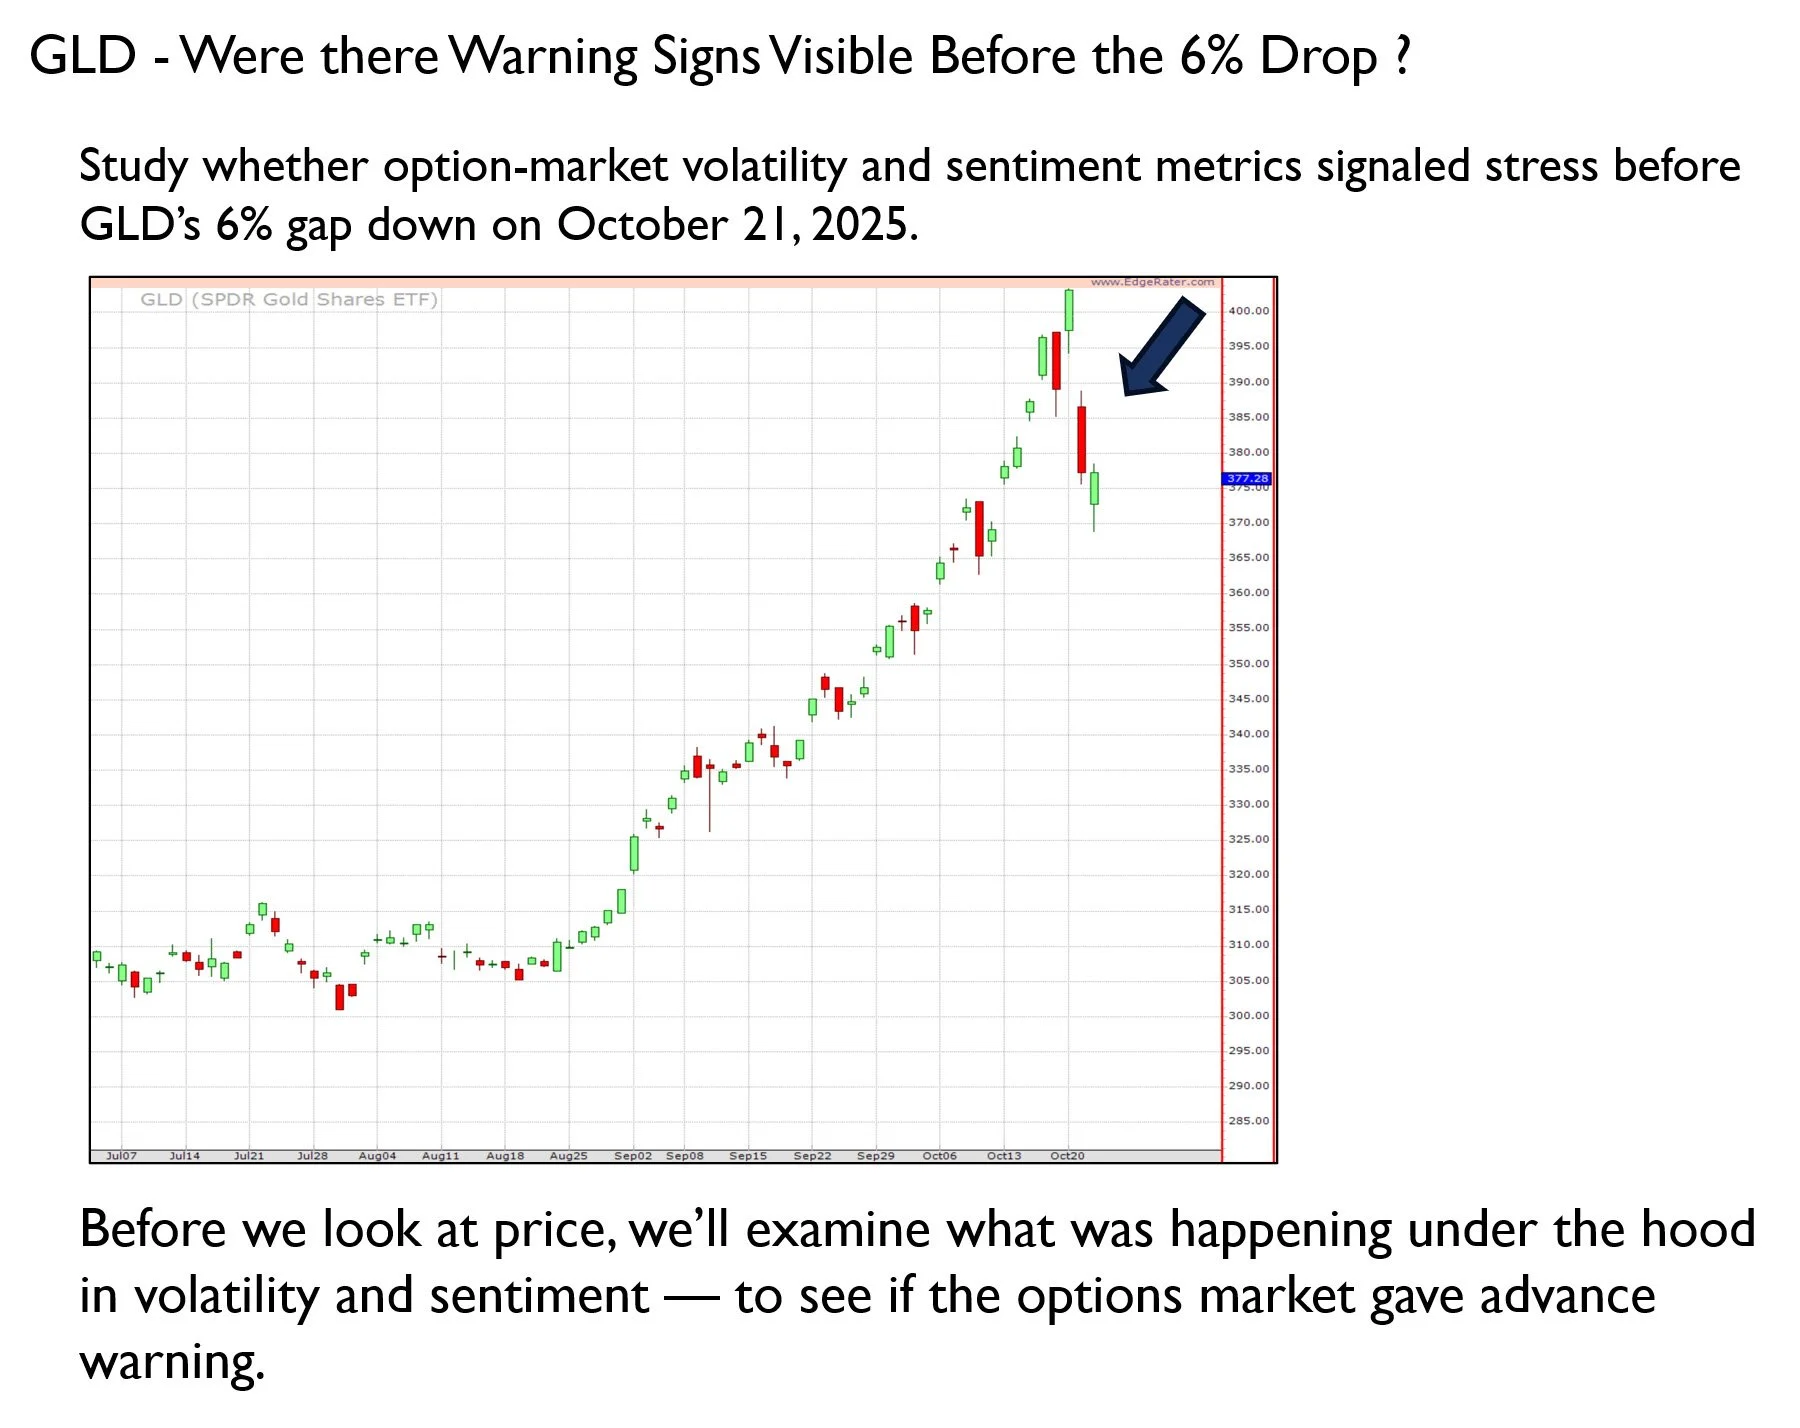
When gold (GLD) plunged 6 percent in a single day on October 21 2025, headlines called it “unexpected.” Inside OBUG – the Owl Bundle User Group, we weren’t forecasting the crash; we were studying whether the market had warned us.
Could those warnings have been visible earlier—in volatility, sentiment, or price structure—through Dr. Ken Long’s RL-stack framework (RL10, RL30, RL90, RL270)? That became the question at the heart of OBUG Meeting #138.
Could the clues have been visible earlier — in volatility, sentiment, or price structure — using Dr. Ken Long’s regression-line analytics? That question became the centerpiece of OBUG Meeting #138.
The Inquiry: Did the Market Whisper First?
Our goal was simple:
Identify early signals that hinted at stress before the October 21 sell-off.
To do that, we paired option-based volatility metrics with Dr. Ken Long’s Regression Line-stack (RL10, RL30, RL90, RL270) — a framework that converts noisy price data into a smooth, multi-time-frame map of trend alignment and energy.
IV22 / HV22 Compare the 22 day implied vs. realized volatility — forward-looking fear vs. backward-looking calm
Put/Call Volume Z-score Detect abnormal hedging or speculative demand — a Sentiment gauge
RL-stack (10,30,90 270) Measure the alignment across the short term 10 period, medium term 30 period, intermediate term 90 period, and 270 period long-term regression lines
What We Found in the Data
Volatility Spoke First
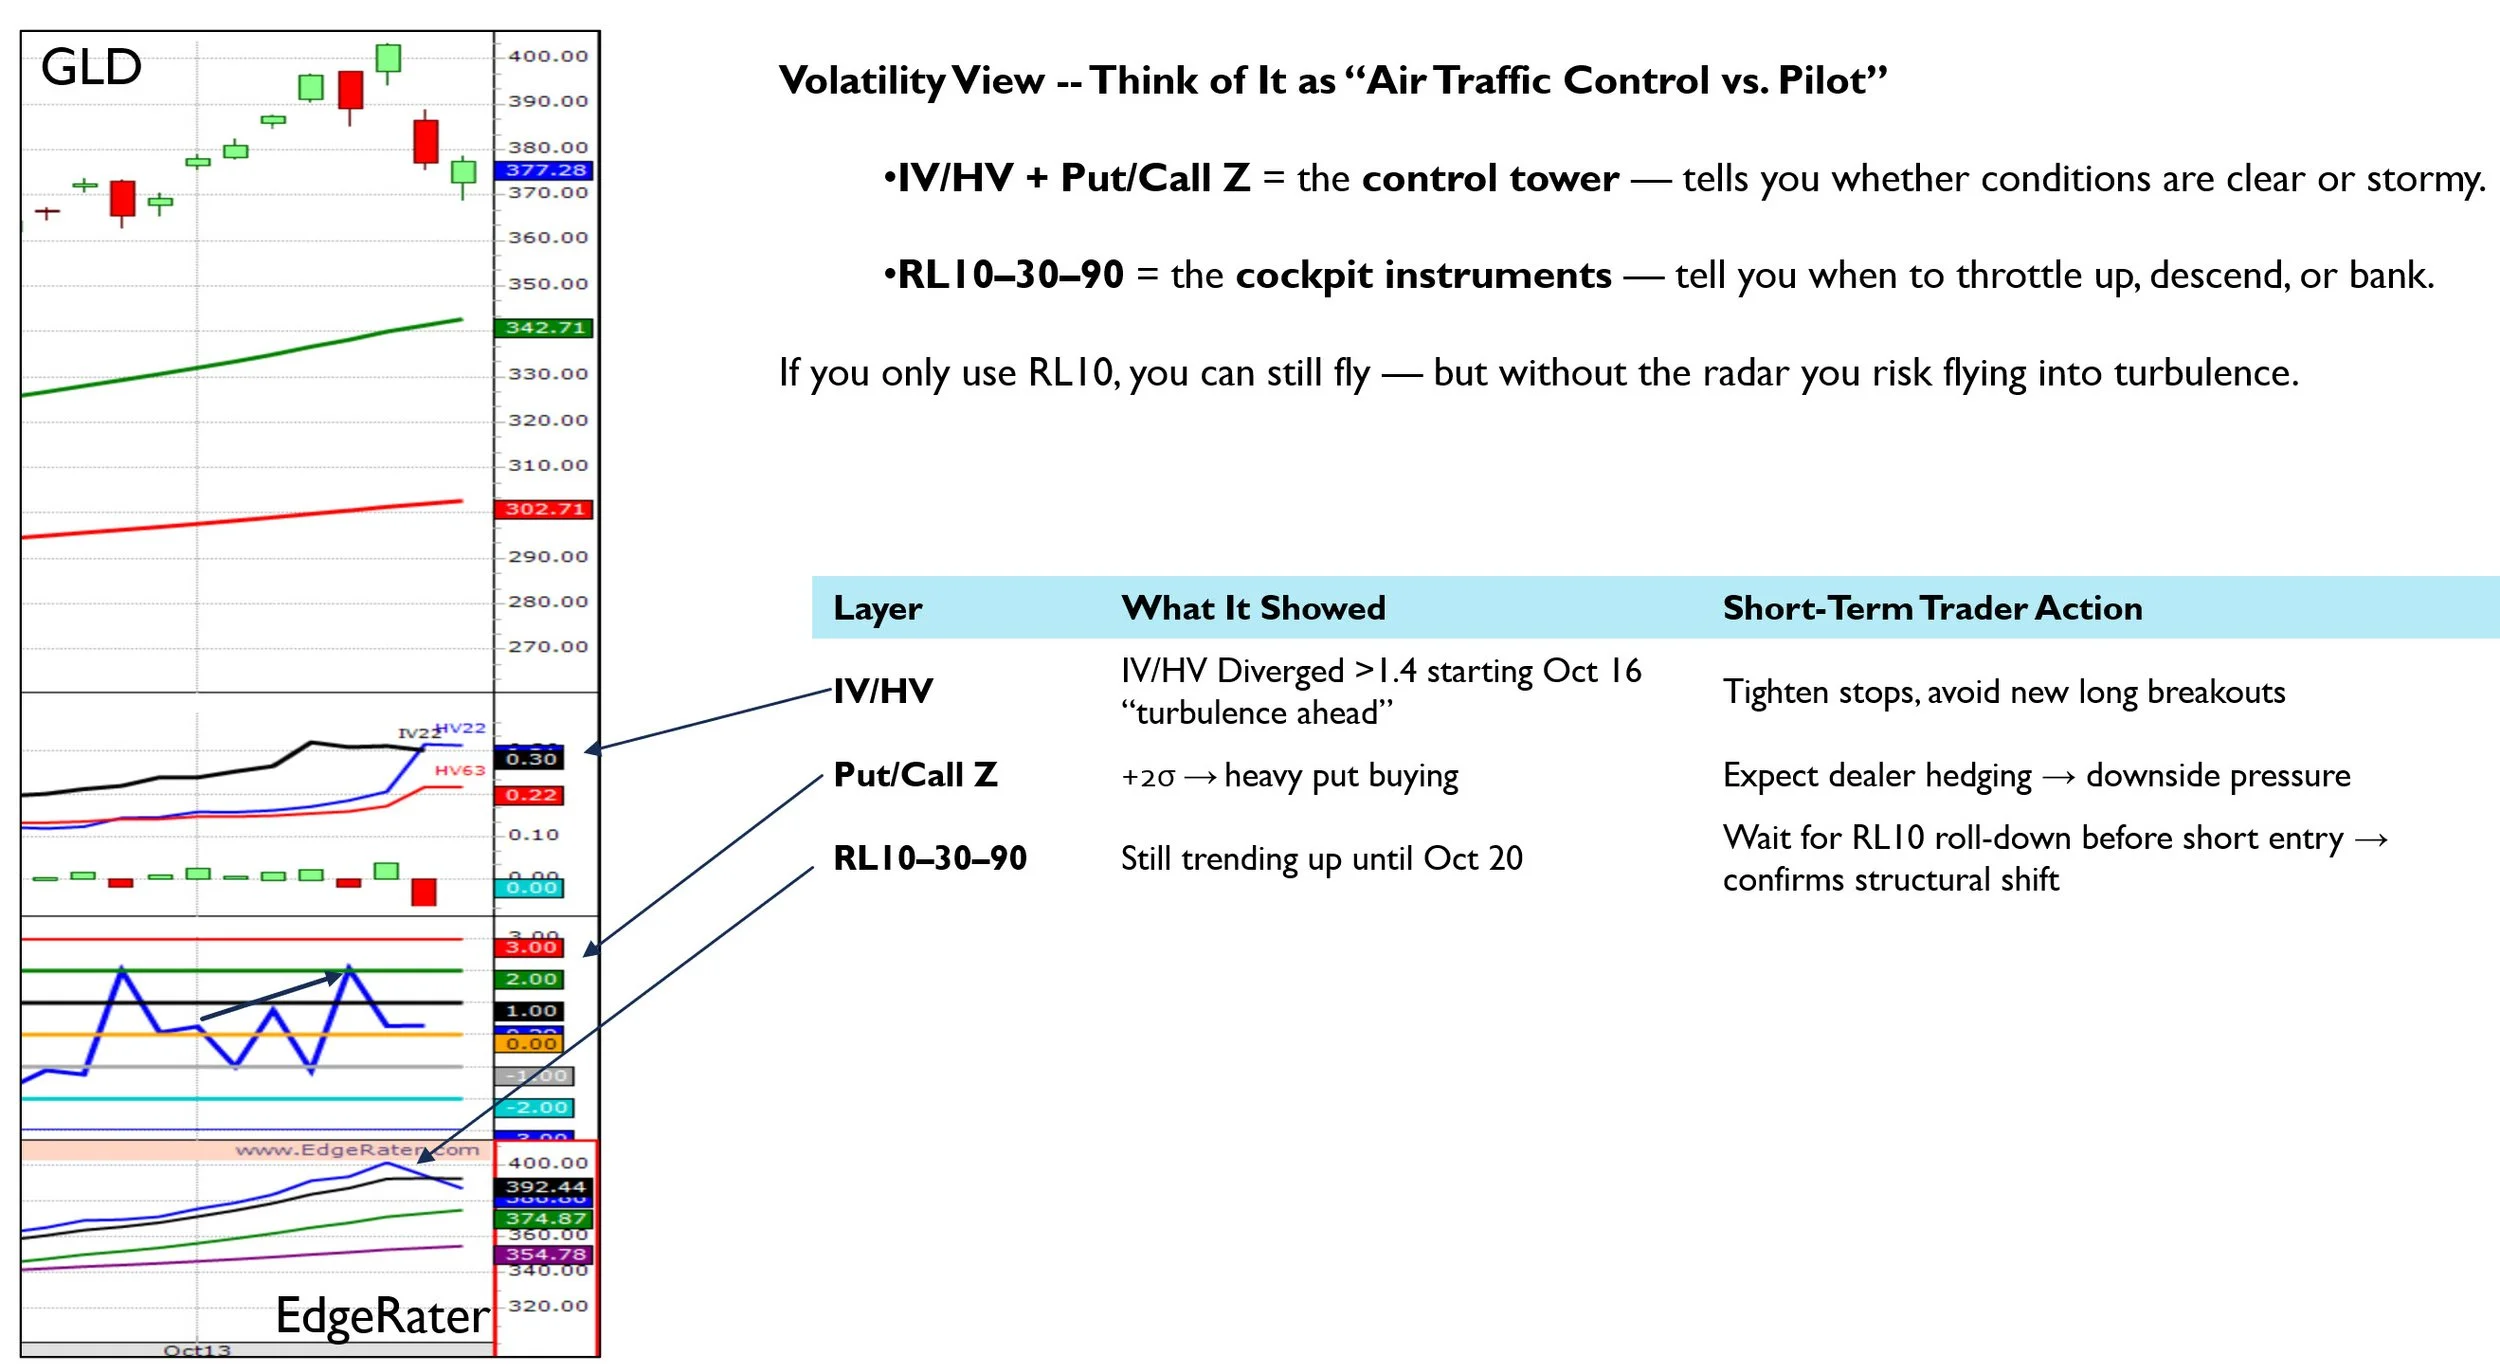
By mid-October, GLD’s IV22 had surged to ≈ 30 % while HV22 hovered near 18 % — a 1.6× divergence. At the same time, the GLD Put/Call Volume Z-score climbed above +2 σ, showing heavy put buying and dealer hedging. These were the market’s first whispers of discomfort — option traders paying up for protection even as GLD prices pressed to new highs.
The RL-Stack Confirmed Later
In the following sessions, RL10 (short-term) began curling down while RL30 flattened. Soon RL90 and RL270 — the intermediate and strategic lenses — lost upward slope.
That sequential rollover is a hallmark of Dr. Ken Long’s “critical state” transition: a quiet, orderly up-trend shifting into disorder. By the time RL10 crossed below RL30, the volatility that had been building beneath the surface finally expressed itself — the 6 % gap-down completed the energy release that IV/HV had warned about.
How the Pieces Fit Together
This study confirmed a consistent timing hierarchy:
Anticipation IV > HV + Put/Call Z risingRLs aligned upwardHidden stress building
Transition IV still rising RL10 diverges from RL30 Momentum faltering
Confirmation IV plateaus RL-stack compresses —> Critical State forms
Expression HV finally surges RL10–30 cross downward —> Price collapse / volatility release
In Dr. Long’s language, volatility represents potential energy, while RL alignment and separation show kinetic release. The two frameworks complement each other — volatility tells when the spring is loaded, the RL-stack shows when it snaps.
Lessons for Traders
Volatility leads structure.
Implied volatility expands before regression-line slopes roll over.Structure leads price.
RL10 → RL30 → RL90 → RL270 sequence provides visible confirmation of regime change.Price is the final expression, not the first signal.
By combining both layers, traders see the transition from quiet to violent well before the headlines.
Why OBUG Studies Matter
OBUG meetings aren’t forecasts — they’re laboratories of market behavior. Each session dissects real data using Dr. Ken Long’s analytical toolkit, building trader intuition about how volatility, structure, and psychology interact.
Members gain:
Weekly multi-asset volatility studies (SPY, GLD, TLT, IWM, etc.)
Live market-scan walkthroughs in EdgeRater
Backtesting templates for the Critical State setups
A global community focused on disciplined, evidence-based trading
Join OBUG to study the Market
If you’re ready to move beyond indicators and learn to read markets as adaptive systems, join the Owl Bundle User Group.
Enroll today at AbleWayTech.com/OBUG
Learn to detect the market’s whispers — before they become shouts.
Disclaimer
OBUG provides education, not investment advice. Trading involves risk; past performance does not guarantee future results.