By Griffin Cooper
11/21/2025
Long-Term Monthly Chart:
Long-Term Analysis of GLD
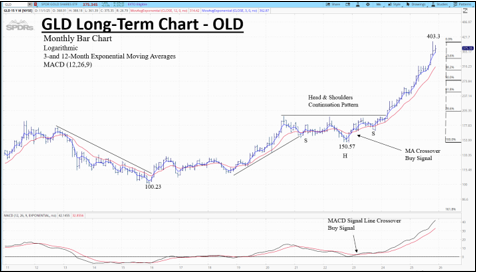
On the monthly chart, a four-year head and shoulders continuation pattern resolved at the beginning of 2024 that has resulted in a dynamic up move with just over a 100% gain in the last two years. The break of the neckline was strong enough that there was not the usual retracement to the neckline after the breakout.
Preceding the resolution of the head and shoulders continuation pattern, the 3 and 12 month exponential moving averages had a bullish crossover in late 2022, and was also confirmed buy a MACD signal line crossover in early 2023.
A 50% retracement from the recent high would bring price back to the 275 level. But with price continuing to make higher highs, the moving averages sloping up, and the MACD line showing positive momentum as well, we go with the trend.
We interpret the monthly chart as continuing to support a bullish long-term trend, while recognizing that this reflects historical chart behavior rather than a prediction or a recommendation.
A bearish moving average crossover, i.e. the 3-month crossing below the 12-month EMA, would change our view and forecast a consolidation period for the market to ‘digest’ the strong up move.
Medium-Term Weekly Chart
Medium-Term Analysis of GLD
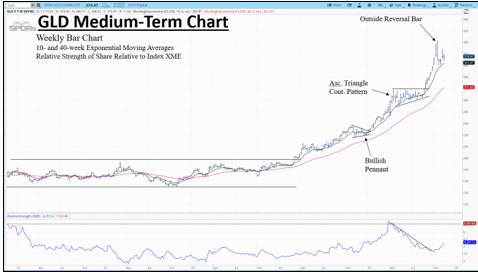
On the weekly chart, a breakout in April of 2024 from a sideways range has produced a strong up trend as evidenced by the 10- and 40- week exponential moving averages sloping steeply upward. Throughout the up move we have seen continued support from the 10-week exponential moving average and two continuation patterns in the forms of a bullish pennant late last year and an ascending triangle continuation pattern this Summer.
Early October produced a large outside reversal bar, which could signal another consolidation after the last move up. Recent price action shows a series of dojis as the market is undecided on its next move.
GLD had been strongly underperforming compared to its sector, XME. But the recent weakness in the metals has resulted in an upside trendline break in the Relative Strength line.
Going with the strong uptrend, a chart-based interpretation would be to monitor the 10-week EMA for potential support and observe whether any additional continuation patterns develop.
Another leg up in equal length to the last breakout would bring us up to a target at the 450 level.
Given the strength of the current trend, price would need to fall below the last consolidation level of 300 or signal a moving average crossover sell signal for our outlook to change.
Short-Term Daily Chart:
Short-Term Analysis of GLD
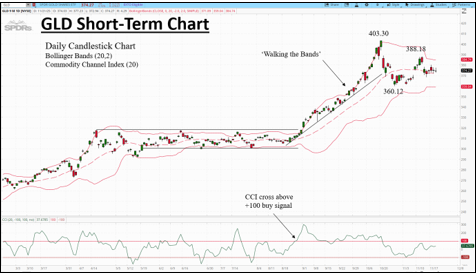
The recent weekly dojis are seen more clearly the daily chart. The 20-period SMA has gone sideways, and price has gone from ‘walking the band’ for two months to a pullback below the support of the 20-day SMA. Volatility has decreased as well as the Bollinger bands have narrowed.
Price is finding support in the last week at the 20-period SMA. A breakout to the upside or a further move down to the bottom band are equally likely. What is clear is that price is in a consolidation, or sideways, mode. This is confirmed in the Commodity Channel Index that is sitting at the zero line, neither oversold or overbought.
From a technical-analysis perspective, the higher timeframes suggest that an upside resolution may be more likely, but the daily chart remains neutral until price breaks the current range.
Another up leg, similar in distance to the previous move from August to October, would elicit a target of 450. Although price is currently sideways until proven otherwise. We would need to see consecutive closes out of the 360.12 to 388.18 range with price starting to ‘walk the band’ to confirm the possible start of a new trend.
Strategy Example
One example of a trading strategy for a band trader could be to buy a new daily high if price pulls back to the bottom band. Additional confirmation with a crossover from -100 to back above -100 in the Commodity Channel Index.
Stop just below the recent low that touched the bottom band. Take profit at the SMA or the top of the band.
For those looking to play the trend continuation, a hypothetical entry method could be initiated when price has posted consecutive closes above the recent swing high at 388.18 and an additional confirmation of the CCI crossing above +100.
Stop below 20-period SMA. Take profits at the 403.30 swing high and eventual target of 450.
This analysis is for educational purposes only and does not constitute investment advice or a recommendation to buy or sell any security. Trading involves risk of loss.


