
Our Owl Bundle User Group (OBUG) has been studying Dr. Ken Long’s methodologies using empirical backtesting inside EdgeRater. Through this process, we have continued to explore how market participation, leadership durability, and tactical market structure influence trading-system performance. One important concept in this work has been the application of Dr. Ken Long’s RL30Slope Z indicator.
Rather than focusing only on price direction, RL30Slope Z helps measure whether leadership is strengthening, weakening, or persisting beneath the surface of price movement. Over time, our research suggested that this information could be used not only for individual trade setups, but also for understanding broader market structure and institutional participation dynamics.
Why We Began Developing These Frameworks
Many traders struggle with the same problems:
Too many symbols to scan
Difficulty adapting to changing market conditions
Confusion between broad market weakness and selective leadership
Applying the wrong tactics in the wrong environment
We began researching whether RL30Slope Z could help address the traders’ concerns. This eventually evolved into two complementary frameworks now used inside OBUG:
OTF (OBUG Tactical Framework)
ORPA (OBUG RL30Slope Z Participation Analyzer)
While these tools are related, they serve very different purposes for traders.
OTF: Understanding the Market Environment
The OBUG Tactical Framework (OTF) was developed to help traders evaluate the overall tactical trading environment. Using market participation, leadership quality, macro alignment, and rotation analysis, OTF attempts to answer a critical question: “What type of trading behavior is statistically favored RIGHT NOW?”
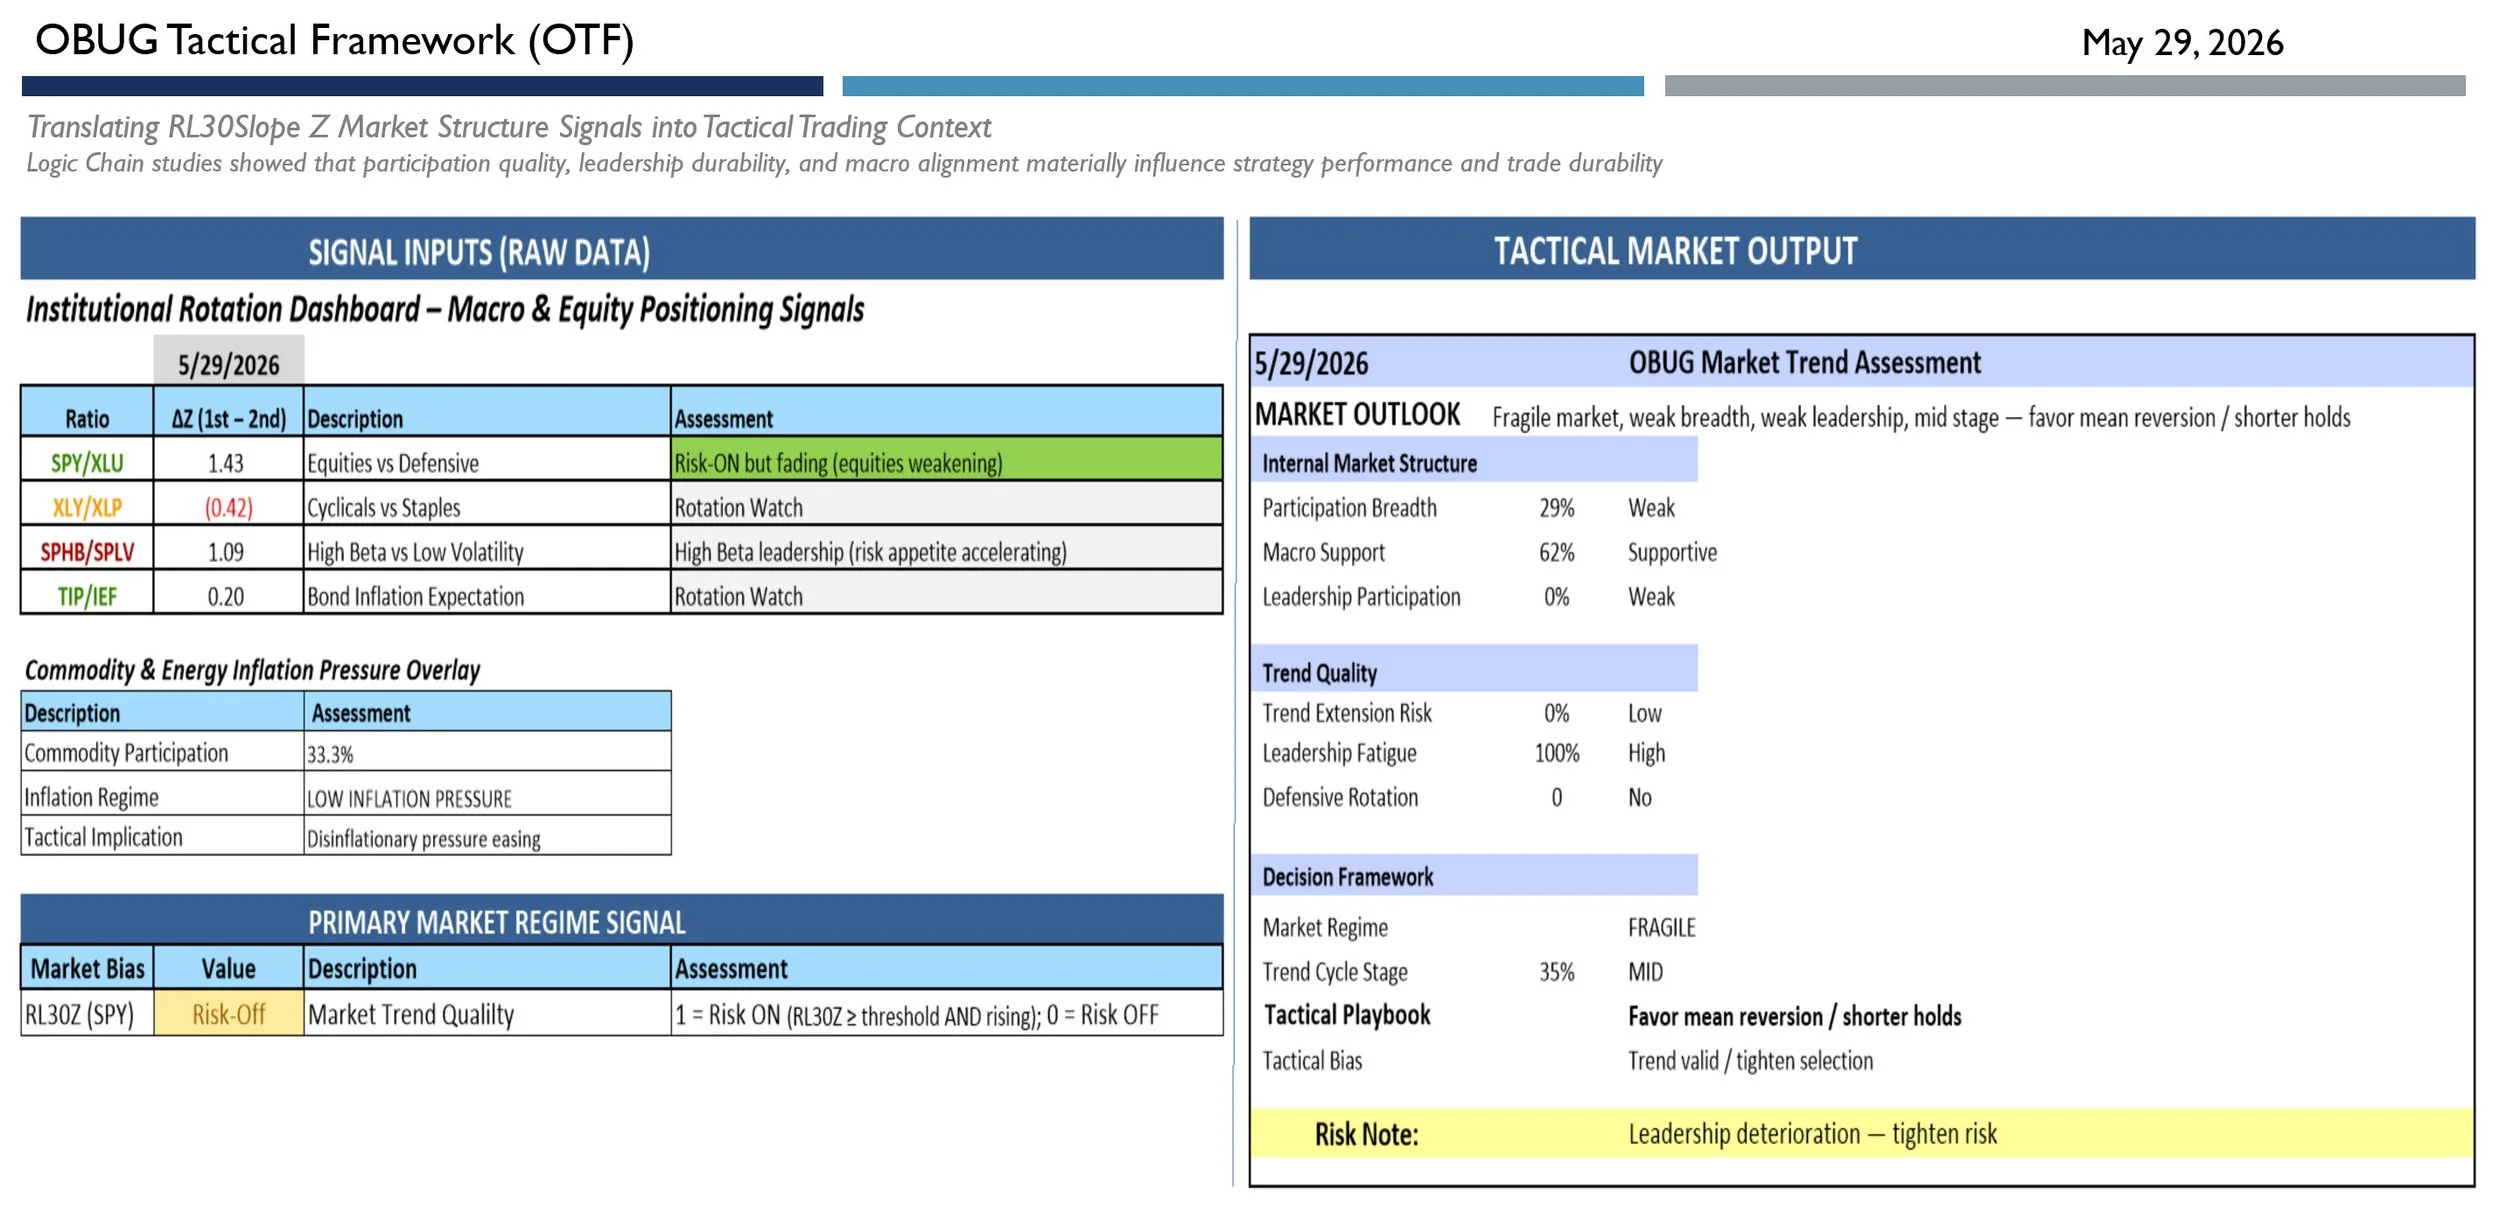
Example of the OBUG Tactical Framework evaluating breadth participation, leadership quality, macro alignment, and tactical market posture.
For example:
Are market conditions favoring trend-following or mean reversion?
Is leadership broadening or narrowing?
Is market participation improving or deteriorating?
Are conditions supportive of longer holding periods or shorter tactical trades?
OTF uses RL30Slope Z to assess:
Breadth participation
Leadership participation
Macro support
Defensive rotation
Trend quality
The goal is not to predict the future, but rather to help traders adapt their tactical posture to the current market environment. In many cases, traders struggle not because their systems are poor, but because they are applying the wrong tactics to the wrong market regime.
ORPA: Identifying Leadership Inside the Market
As OTF evolved, another important question emerged: “If leadership is narrow, which symbols are actually driving that leadership?”
This led to the development of ORPA (OBUG RL30Slope Z Participation Analyzer).
ORPA uses recurring RL30Slope Z participation analysis over rolling windows to identify symbols and themes showing repeated acceleration and persistence.
Rather than acting as a buy/sell signal generator, ORPA is designed as a market intelligence and leadership-detection framework.
It helps identify:
Symbols showing recurring participation
Strengthening market themes
Emerging institutional sponsorship
Persistent leadership clusters
Areas where participation is accelerating or deteriorating
In many ways, ORPA attempts to identify the “next Ohtani” symbols — names quietly gaining repeated sponsorship before they become obvious market favorites.
Importantly, ORPA is not forecasting earnings or predicting macroeconomic outcomes.
Instead, it measures observable participation behavior inside the market itself.
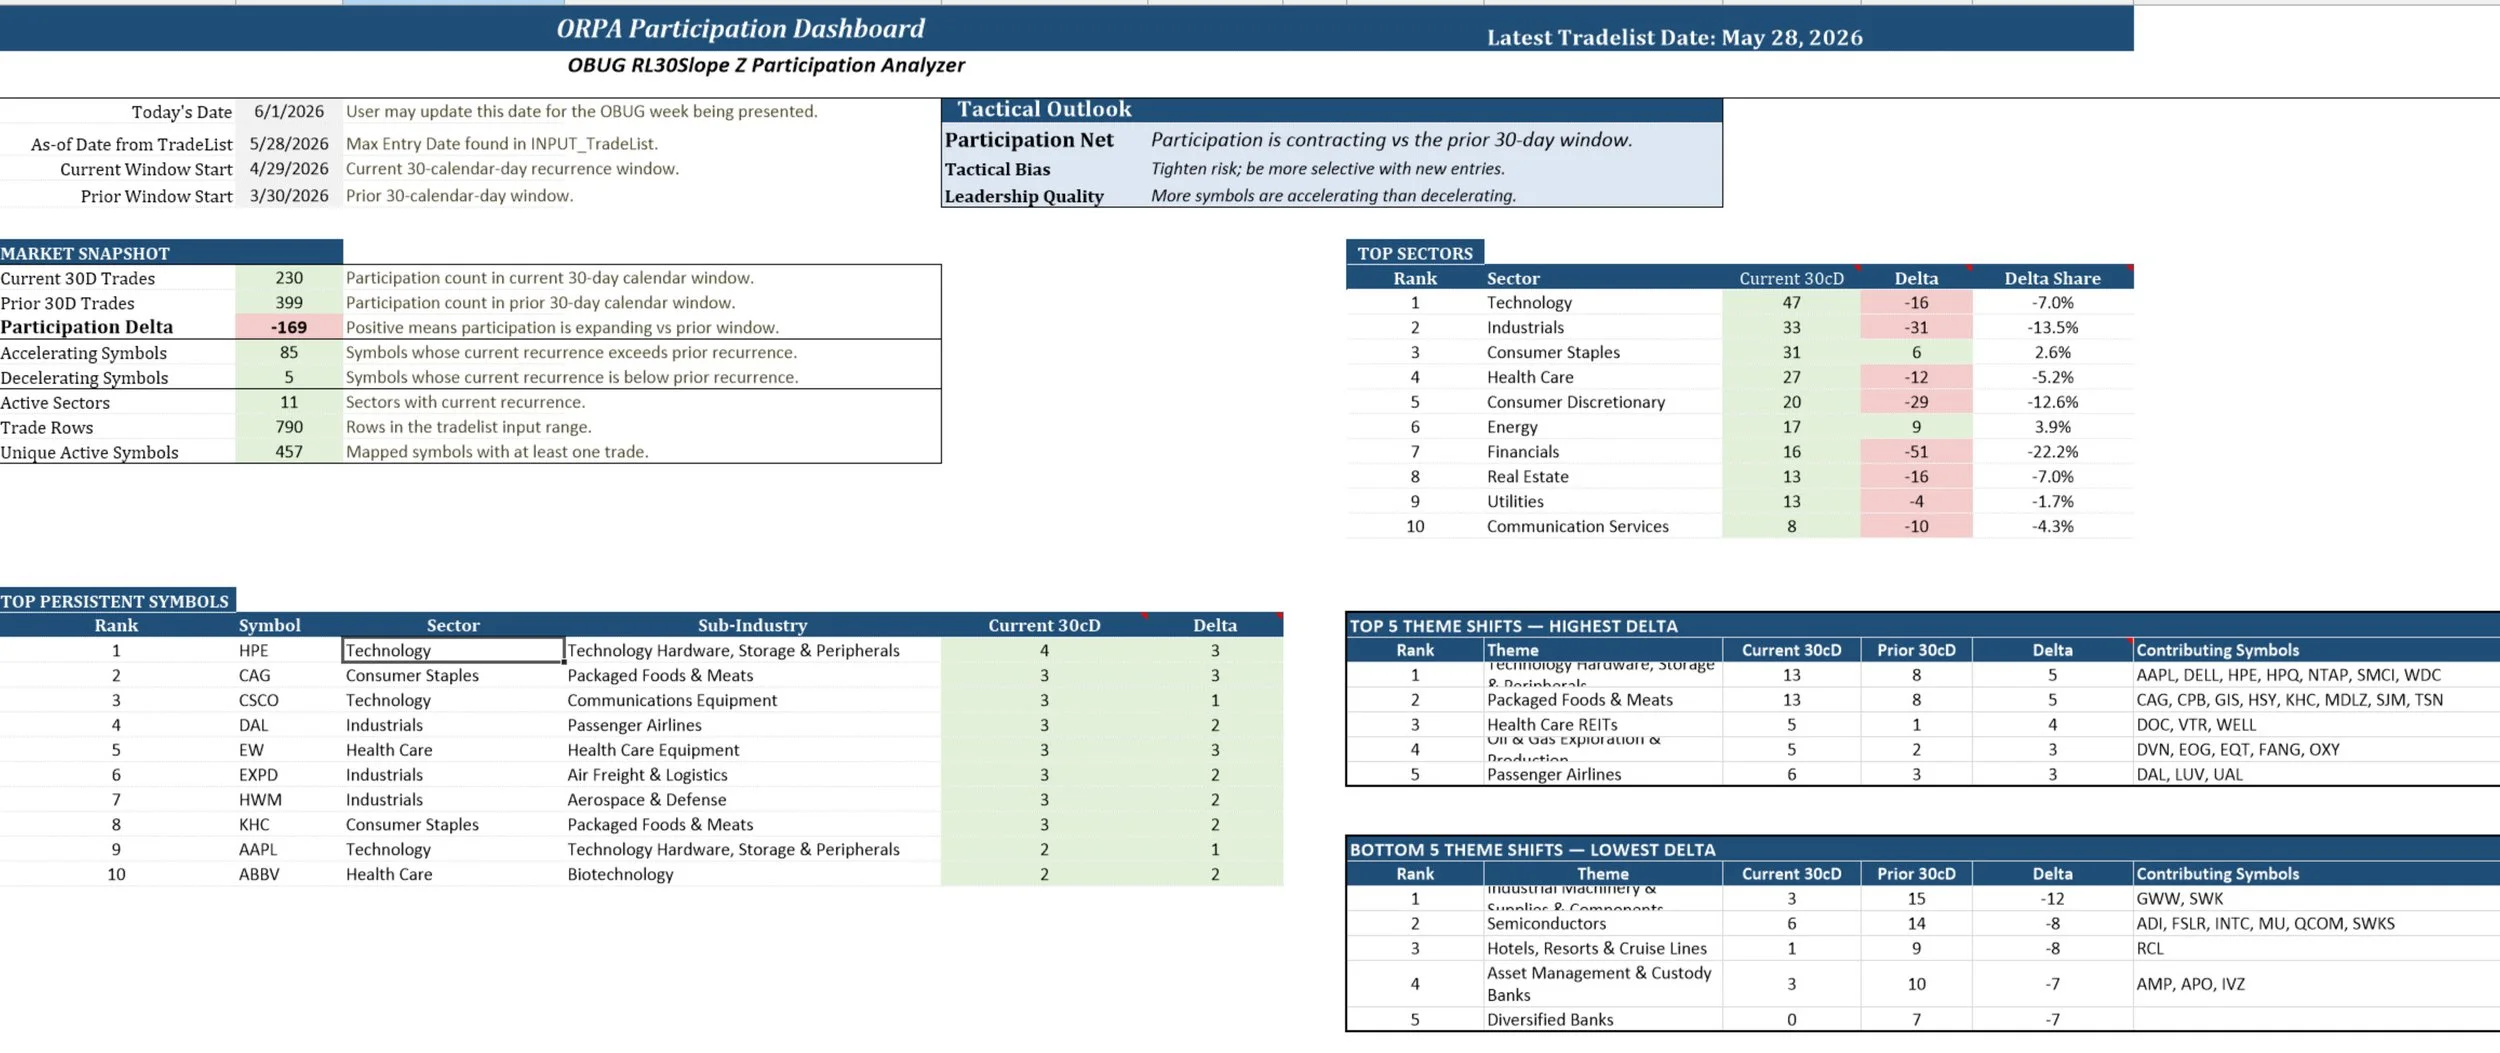
Example of the ORPA dashboard highlighting recurring participation, persistent leadership, and strengthening institutional sponsorship themes.
How OTF and ORPA Work Together
One of the simplest ways to understand the relationship is:
Suppose OTF indicates:
weak breadth
fragile participation
shorter holding periods favored
At the same time, ORPA may reveal recurring participation in:
cybersecurity
aerospace & defense
infrastructure
Instead of scanning hundreds of random symbols, traders can focus their attention on areas showing persistent sponsorship despite weaker overall market conditions.
Another way to think about it: OTF helps traders understand: “HOW should I trade this market?” ORPA helps traders understand: “WHAT symbols and themes deserve my focus?”
Together, they help traders become more selective and context-aware rather than randomly scanning for setups.
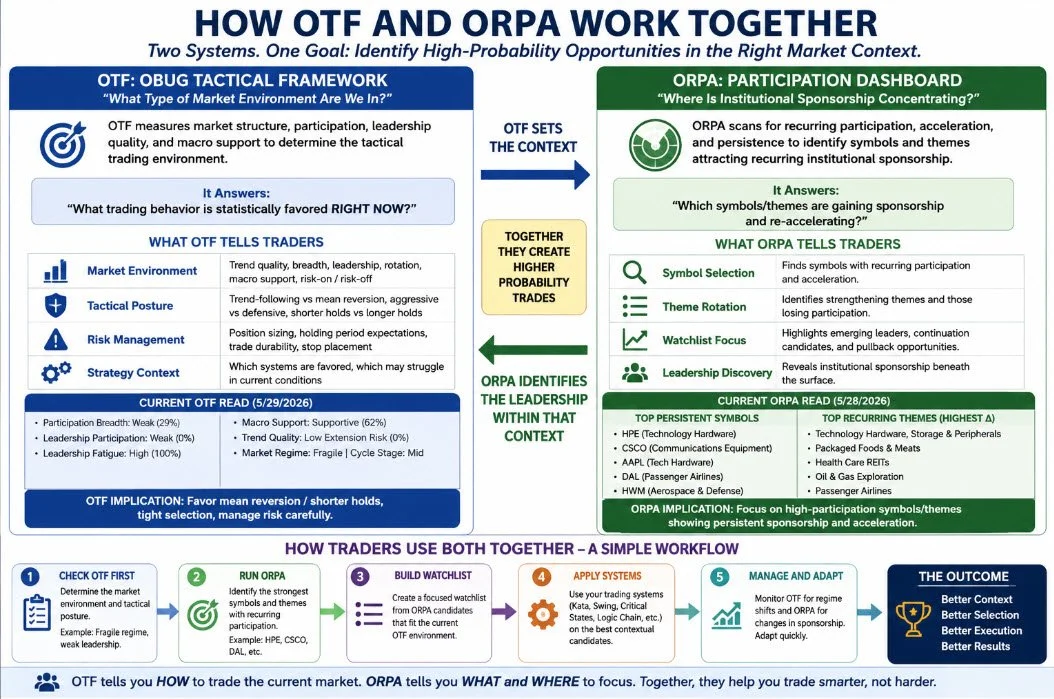
OTF helps determine the tactical trading environment. ORPA identifies the leadership and sponsorship clusters operating within that environment.
Why This Matters for Traders
Most traders focus almost entirely on: entries, exits, and indicators
However, our ongoing OBUG research suggests that market context and participation quality materially influence trading-system durability.
Two traders can use the exact same setup and experience dramatically different outcomes depending on:
market breadth
leadership quality
volatility regime
participation persistence
macro alignment
OTF and ORPA were developed to help traders become: more selective, more adaptive, and more context-aware rather than simply scanning randomly for setups.
Final Thoughts
Markets are increasingly driven by: concentration, institutional flows, thematic rotation, volatility regimes, and macro crosscurrents
We believe traders who understand market structure and participation quality may gain a significant advantage over those relying solely on isolated indicators or headlines.
OTF helps traders understand HOW to trade the current market environment.
ORPA helps traders understand WHAT and WHERE to focus on within that environment.
We invite you to learn more about the Owl Bundle User Group (OBUG) and join us as we continue exploring these evolving frameworks together.