By Griffin Cooper
Lately I have been tracking the Dow Jones Index closely, and focusing on one setup that I have started to see occur with a good amount of frequency. Narrowing down my focus to one setup, and even on one symbol, has consistently proved to my best way to move my own learning forward with the markets. It becomes a very manageable process and ritual, and I get to know all the little nuances that make all the difference.
My area of focus has been the afternoon of the US session, coming out of the mid-day lunch hour. Why this time period? It works well for me, as my mornings are chock full of kids and pets and other wonderful chaos. Plus, the lunchtime in New York is 9:30-ish out here on the West Coast, so it’s typically when I sit down at my desk, and am caffeinated enough to concentrate without any distractions.
The setup I want to talk about today is the Sideways Afternoon Breakout. Dr. Ken Long would call this a ‘pinch’ or ‘Z3P’ breakout. Others call it a sideways coil or sideways quiet channel. A rose by any other name would smell as sweet, and this sweet setup is simply that price has generally been rotating in the morning session and come down to an equilibrium level. The concept of contraction followed by range expansion of price has been around for nearly a century.
“Periods of dullness are followed by periods of activity.” -Charles Dow
The tell for this setup is that the price action will have converging trend lines that can be drawn on the recent highs and lows that show the market participants have temporarily have agreed on a price level. But this agreement often doesn’t last long, and the beginning of the afternoon session can often be a nice directional move out of this equilibrium point.
Dr. Ken Long and many in the Owl Group of traders use a Bollinger Band function to identify the volatility compression. I like to use a simple ADX indicator because it can measure the amount of overlap of consecutive price bars. When the ADX hits a low reading, there is a confirmation of compression of price action.
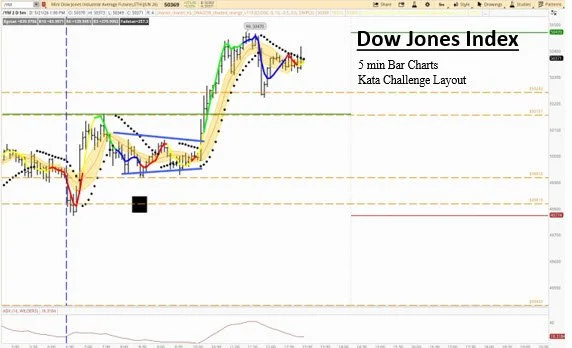
Chart 1
These are typically small bites type of trades, with a test of the intraday high or low a good place to look for price to test. The example in Chart 1 ended up having a large follow-through, as price rallied all the way through yesterday’s high and closed near the high of the day.
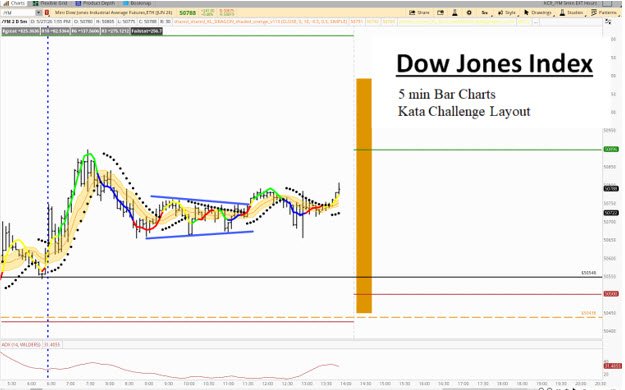
Chart 2
The second example in chart 2 shows a similar setup, but no follow through after the breakout. Alas, no setup is infallible, but what’s interesting is to a take a quick look at the contrast in volume when the breakout occurred on these two examples.
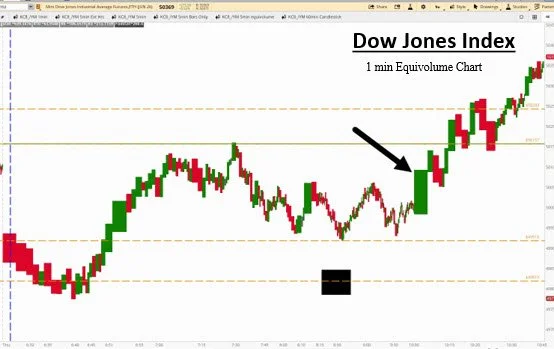
Chart 3
Chart 3 is an equivolume chart of the same price action as Chart 1. Equivolume was developed by Richard Arms and combines price range and volume into a single visual element. The width of the bar is proportional to the volume, so wide bars show that larger volume has come into play. Large volumes can often mean higher timeframe players with large funds, and can lead to larger follow-through.
The 1-minute equivolume chart pinpoints that at the moment of breakout from the sideways coil there was a massive influx of volume shown by the very wide bar. This can be seen on the regular price chart as well, as the price bar had a very large range. The equivolume chart just adds some confirmation.
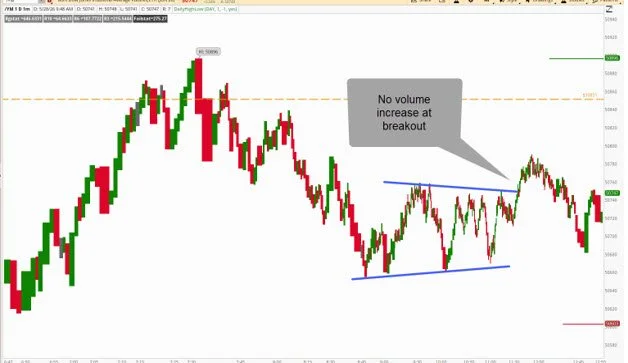
Contrast that with our second example, in Chart 4, the same price action as Chart 2, that did not follow through after price broke out of the narrow range, and there is no additional volume present. No wide bar. Nobody’s home. No follow-through. The first example could give us more confidence and structure to hold the trade through the session, while the second example could serve as an alert to get ready and bail.
If you’re interested in learning more about how we analyze markets and trade, check out Ablewaytech.com and stay tuned for our next course, Critical States and Kata Challenge, coming this Fall!
Happy Trading,
Griffin Cooper, MSTA, CFTe