By Griffin Cooper
9/12/2025
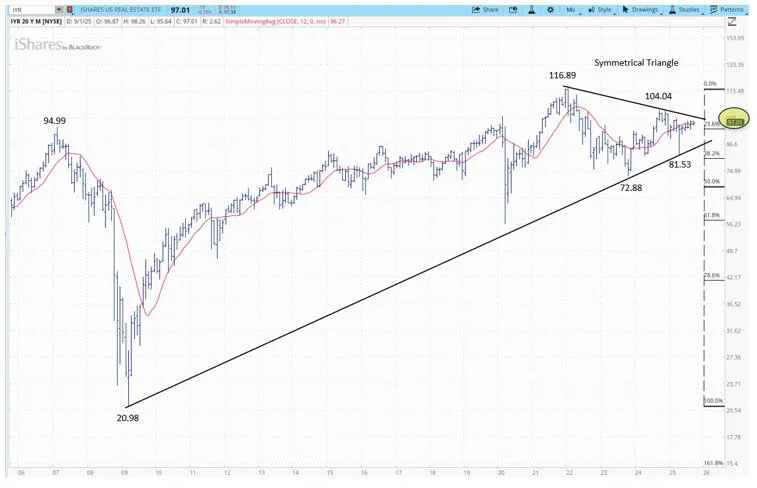
IYR Monthly Long-Term Chart:
IYR Long-term Analysis:
A dynamic selloff during the 2008 real estate crash, where price in IYR dropped nearly 78%, has been followed by a sixteen-year up channel on the long-term chart with a confirmed trend line at this stage.
The selloff from the beginning of 2022 to the end of 2023 found support just shy of the 50% Fibonacci retracement level at 72.88. The next leg up produced a lower reaction high in the middle of 2024 at 104.04, followed by a higher reaction low early this year at 81.53 This current consolidation looks to be taking the shape of a symmetrical triangle- a difficult pattern to use in forecasting, but more usually viewed as a continuation.
Our current view is to stay with the trend and the more likely upside triangle breakout. Although another touch of the trend line support around 86 would still be in line with the forecast, a break will need to be achieved soon to produce a vigorous next move, particularly with triangle’s top line sitting at the important psychological round number of 100.
A decisive two-day close below the last reaction low of 81.53 would change that view.
IYR Weekly Medium-Term Chart:
IYR Medium-term Analysis:
The move off the October 2023 low of 72.88 resulted in a one-year uptrend that started a sideways consolidation period in early 2025. The recent rally off the April low of 81.53 has led to a MACD crossover of both the signal line and zero line, a sign of bullishness and that the trend is picking up momentum.
Price comes first, and the current consolidation is taking the shape of an inverted head and shoulders pattern with two heads. This can be viewed as a continuation pattern. We look for a break of the neckline of the pattern in the next few weeks, with a pattern resolution of 120.
Being an inverse pattern that will rely on buying pressure to resolve successfully, it is essential that the rally through the neckline be accompanied by a sharp burst of trading volume.
A failure to break the neckline in the next few weeks or a breakout and subsequent close below the neckline would change our outlook.
Strategy:
If volume confirms the breakout with a sharp increase during the neckline break (and decrease during the return move), one could look to enter on the return move back to the neckline with a stop slightly below the neckline and a take profit of 120.
This analysis is for educational purposes only and does not constitute investment advice or a recommendation to buy or sell any security. Trading involves risk of loss.


