
By Griffin Cooper
9/4/2025
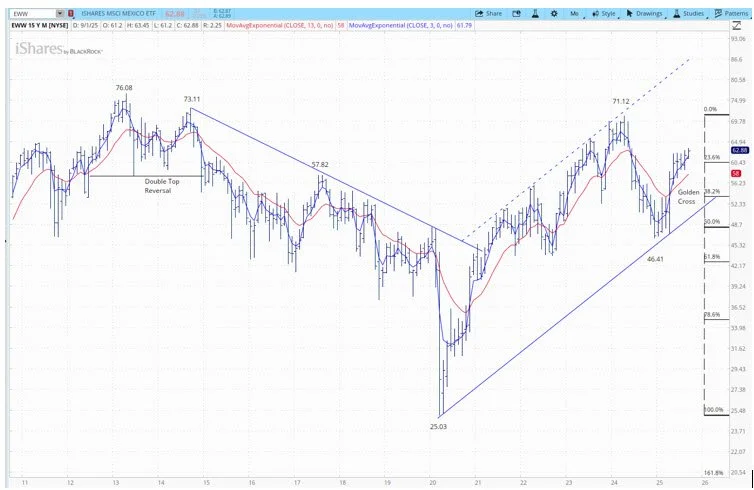
EWW Monthly Long-Term Chart:
EWW Long-term Analysis:
A double-top reversal at the end of the 2014 started a five-year downtrend that bottomed in March of 2020 at 25.03 The last five years on the long-term monthly chart show an up channel with a still tentative support line at this stage.
However, we go with the trend as the 2024 sell-off found support at the 50% Fibonacci retracement of the post 2020 bull market and a large bullish outside reversal bar with a significantly higher monthly close was achieved in April of this year.
Also to note, the 3/13-month EMA combination still supports the long-term bull trend with a recent golden cross buy signal.
We look for continuation of a broad bull channel. A decisive setback, with a close below 46.41, would change that view.
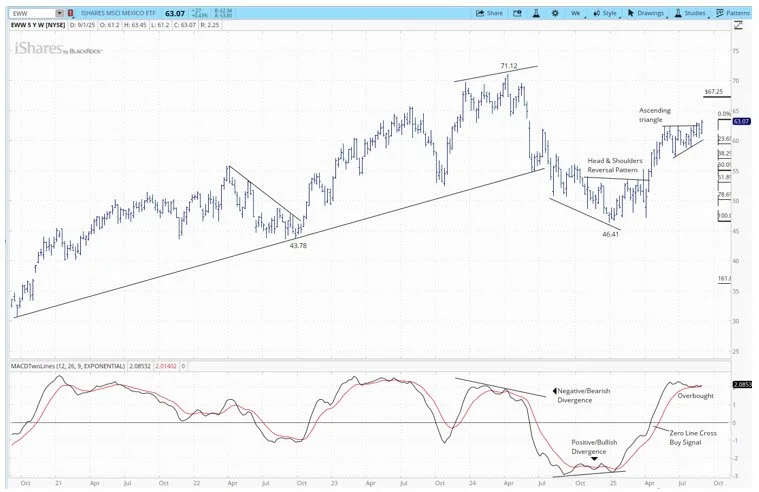
EWW Weekly Medium-Term Chart:
EWW Medium-term Analysis:
A negative divergence in the first half of 2024 ended in dynamic move down, ultimately breaking the trend line and continuing lower to 46.41 in December of last year. A head should and shoulders pattern triggered in April, coinciding with a MACD zero-line cross buy signal, that was able to reverse the medium-term downtrend, also confirmed with a bullish divergence in the MACD.
The consequent rally off 46.41 sees the weekly MACD now overbought. But price action comes first. Current consolidation takes the shape of an ascending triangle with a recent breakout and close above the flat line.
We go with the trend and look for a triangle resolution target of 67.25, and an eventual test of the high of 71.12.
A close below 57.28 would change our outlook and signal further consolidation and unwinding of the MACD, with a further 61.8% pullback to prior resistance levels at 53.
Strategy: One possible strategy example is watching for a breakout above the high of the weekly bar, with risk management below the recent swing low (around 60.44) and potential profit-taking areas in the 67.25 and 70–71 zones.
This analysis is for educational purposes only and does not constitute investment advice or a recommendation to buy or sell any security. Trading involves risk of loss.